Troubleshooting
This article provides troubleshooting information for various tools and features in Pomerium.
Pomerium Core
HTTP Strict Transport Security (HSTS)
By default, Pomerium sends the Strict-Transport-Security response header to the browser, which pins the certificate to our browser for one year. This is common best practice to help prevent man-in-the-middle attacks but can create issues while a new Pomerium configuration is in development.
When you visit an endpoint while Pomerium is using an untrusted certificate (like the self-signed bootstrap certificate or a Let's Encrypt staging certificate), that certificate may be pinned in your browser. Once Pomerium is switched to a trusted production certificate, the untrusted cert must reset in the browser.
While developing your Pomerium environment, consider adjusting the SET_RESPONSE_HEADERS key to remove Strict-Transport-Security or reduce the max-age value until your production certificates are in place.
See this article for more information on clearing HSTS for specific endpoints across common browsers.
JWT Authentication
When securing the Pomerium Authenticate service with a certificate signed by Let's Encrypt, your upstream applications may reject the certificate when attempting to access the JWT signing key. Here's an example log line from Grafana:
logger=context error=Get "https://grafana.localhost.pomerium.io/.well-known/pomerium/jwks.json": x509: certificate signed by unknown authority
This is often due to the recent expiration of the DST Root CA X3 certificate. Many default keystores used by docker images and less-frequently updated distributions still carry this expired certificate. Even though Let's Encrypt certs are cross-signed with the ISRG Root X1 CA certificate, some applications will still reject them.
To clarify; this does not mean that the upstream service is rejecting the JWT signing key. Rather, it doesn't trust the Let's Encrypt certificate used by the Authorize service for TLS, and so it will not read the JWKS file.
For upstream applications that can use a local signing key file, you can circumvent this issue using curl or wget to download the signing key locally (relative to the upstream service). Using Grafana again as an example:
Download the
jwks.jsonfile from the authenticate server:- curl
- wget
curl https://grafana.localhost.pomerium.io/.well-known/pomerium/jwks.json > /etc/grafana/jwks.jsonwget -O /etc/grafana/jwks.json https://grafana.localhost.pomerium.io/.well-known/pomerium/jwks.jsonEdit the upstream service configuration to use the local key to verify tokens:
[auth.jwt]
enabled = true
header_name = X-Pomerium-Jwt-Assertion
email_claim = email
jwk_set_file = /etc/grafana/jwks.json
cache_ttl = 60m
Kubernetes Ingress Controller
View Event History
Pomerium Ingress Controller will add events to the Ingress objects as it processes them.
kubectl describe ingress/my-ingress
Events:
  Type    Reason   Age   From              Message
  ----    ------   ----  ----              -------
  Normal  Updated  18s   pomerium-ingress  updated pomerium configuration
If an error occurs, it may be reflected in the events:
Events:
  Type     Reason       Age                 From              Message
  ----     ------       ----                ----              -------
  Normal   Updated      5m53s               pomerium-ingress  updated pomerium configuration
  Warning  UpdateError  3s                  pomerium-ingress  upsert routes: parsing ingress: annotations: applying policy annotations: parsing policy: invalid rules in policy: unsupported conditional "maybe", only and, or, not, nor and action are allowed
Shared Secret Mismatch
Pomerium's independent services communicate securely using a shared secret. When services or the databroker have mismatched secrets, Pomerium will fail.
Pomerium Core will log a shared secret mismatch with:
{
  "level": "error",
  "syncer_id": "authorize",
  "syncer_type": "",
  "error": "rpc error: code = Unauthenticated desc = invalid JWT: go-jose/go-jose: error in cryptographic primitive",
  "time": "2022-03-22T07:26:14-04:00",
  "message": "sync"
}
And Pomerium Enterprise will log the error with:
{
  "level": "error",
  "ts": "2022-03-22T07:21:02-04:00",
  "caller": "dashboard/server.go:187",
  "msg": "syncer",
  "error": "failed to sync all devices: rpc error: code = Unauthenticated desc = invalid JWT: go-jose/go-jose: error in cryptographic primitive",
  "stacktrace": "github.com/pomerium/pomerium-console/svc/dashboard.(*Server).Run.func2\n\t/PATH/TO/POMERIUM/CONSOLE/SERVICE/svc/dashboard/server.go:187\ngolang.org/x/sync/errgroup.(*Group).Go.func1\n\t/Users/tgroth/workspace/go/pkg/mod/golang.org/x/sync@v0.0.0-20210220032951-036812b2e83c/errgroup/errgroup.go:57"
}
{
  "level": "info",
  "ts": "2022-03-22T07:21:02-04:00",
  "caller": "dashboard/server.go:202",
  "msg": "stopping dashboard servers"
}
Update the shared secret across all Pomerium services to match the one set for the Databroker.
Redis Secret Mismatch
The use of Redis as the databroker storage type has been deprecated in favor of Postgres. See Previous Versions of this page for information regarding Redis.
RPC Errors
certificate signed by unknown authority
When authenticating and authorizing a user for the first time, you may see the following in your Pomerium logs:
ERR http-error error="401 Unauthorized: ..... rpc error: code = DeadlineExceeded desc = latest connection error: connection error: desc = "transport: authentication handshake failed: x509: certificate signed by unknown authority...."
Why
This error means that the proxy is rejecting the Authorize service's supplied certificate (used to establish a secure connection) because it doesn't know or trust the certificate authority that signed it.
Solution
Ensure that the Proxy service knows about and trusts the certificate authority that signed the Authorize service's certificate.
Add the certificate authority directly into Pomerium using the certificate authority config setting.
Add the certificate authority to the system's underlying trust store.
Replace your system / docker image certificate bundle.
For Docker:
COPY --from=builder /etc/ssl/certs/your-cert-bundle.crt /etc/ssl/certs/ca-certificates.crtFinally, ensure that you aren't being man-in-the-middle'd or that some eager router isn't injecting its own certificate along the way. Use openssl to verify that your Proxy service is getting the certificate you think its getting.
openssl s_client -servername pomerium.io -connect pomerium.io:443 </dev/null \
| sed -ne '/-BEGIN CERTIFICATE-/,/-END CERTIFICATE-/p'
rpc error: code = DeadlineExceeded
When authenticating and authorizing a user for the first time, you may get the following in your Pomerium logs.
{"level":"error",..."error":"rpc error: code = DeadlineExceeded desc = context deadline exceeded","http-message":"rpc error: code = DeadlineExceeded desc = context deadline exceeded","http-code":500,"message":"http-error"}
Why
The Proxy service is not able to create a connection with the authorization service to validate a user.
Solution
Usually, this is the result of either a routing issue or a configuration error. Make sure that you are using the internally routable URL for the Authorize service. Many cloud loud balancers do not yet support gRPC transposing the ingress. So while your authenticate service url will probably look like https://authenticate.corp.example.com, your authorizer service url will likely be more like https://pomerium-authorize-service.default.svc.cluster.local or https://localhost:5443.
Pomerium Enterprise
Generate Recovery Token
In the event that you lose access to the console via delegated access (the policy defined in Pomerium), there exists a fallback procedure to regain access to the console via a generated recovery token.
To generate a token, run the pomerium-console generate-recovery token command with the following flags:
| Flag | Description |
|---|---|
--database-encryption-key | base64-encoded encryption key for encrypting sensitive data in the database. |
--database-url | The database to connect to (default "postgresql://pomerium:pomerium@localhost:5432/dashboard?sslmode=disable"). |
--namespace | The namespace to use (default "9d8dbd2c-8cce-4e66-9c1f-c490b4a07243" for Global). |
--out | Where to save the JWT. If not specified, it will be printed to stdout. |
--ttl | The amount of time before the recovery token expires. Requires a unit (example: 30s, 5m). |
You can run the pomerium-console binary from any device with access to the database.
Directory sync
Problem:
Enterprise Console directory sync fails to complete.
Solution:
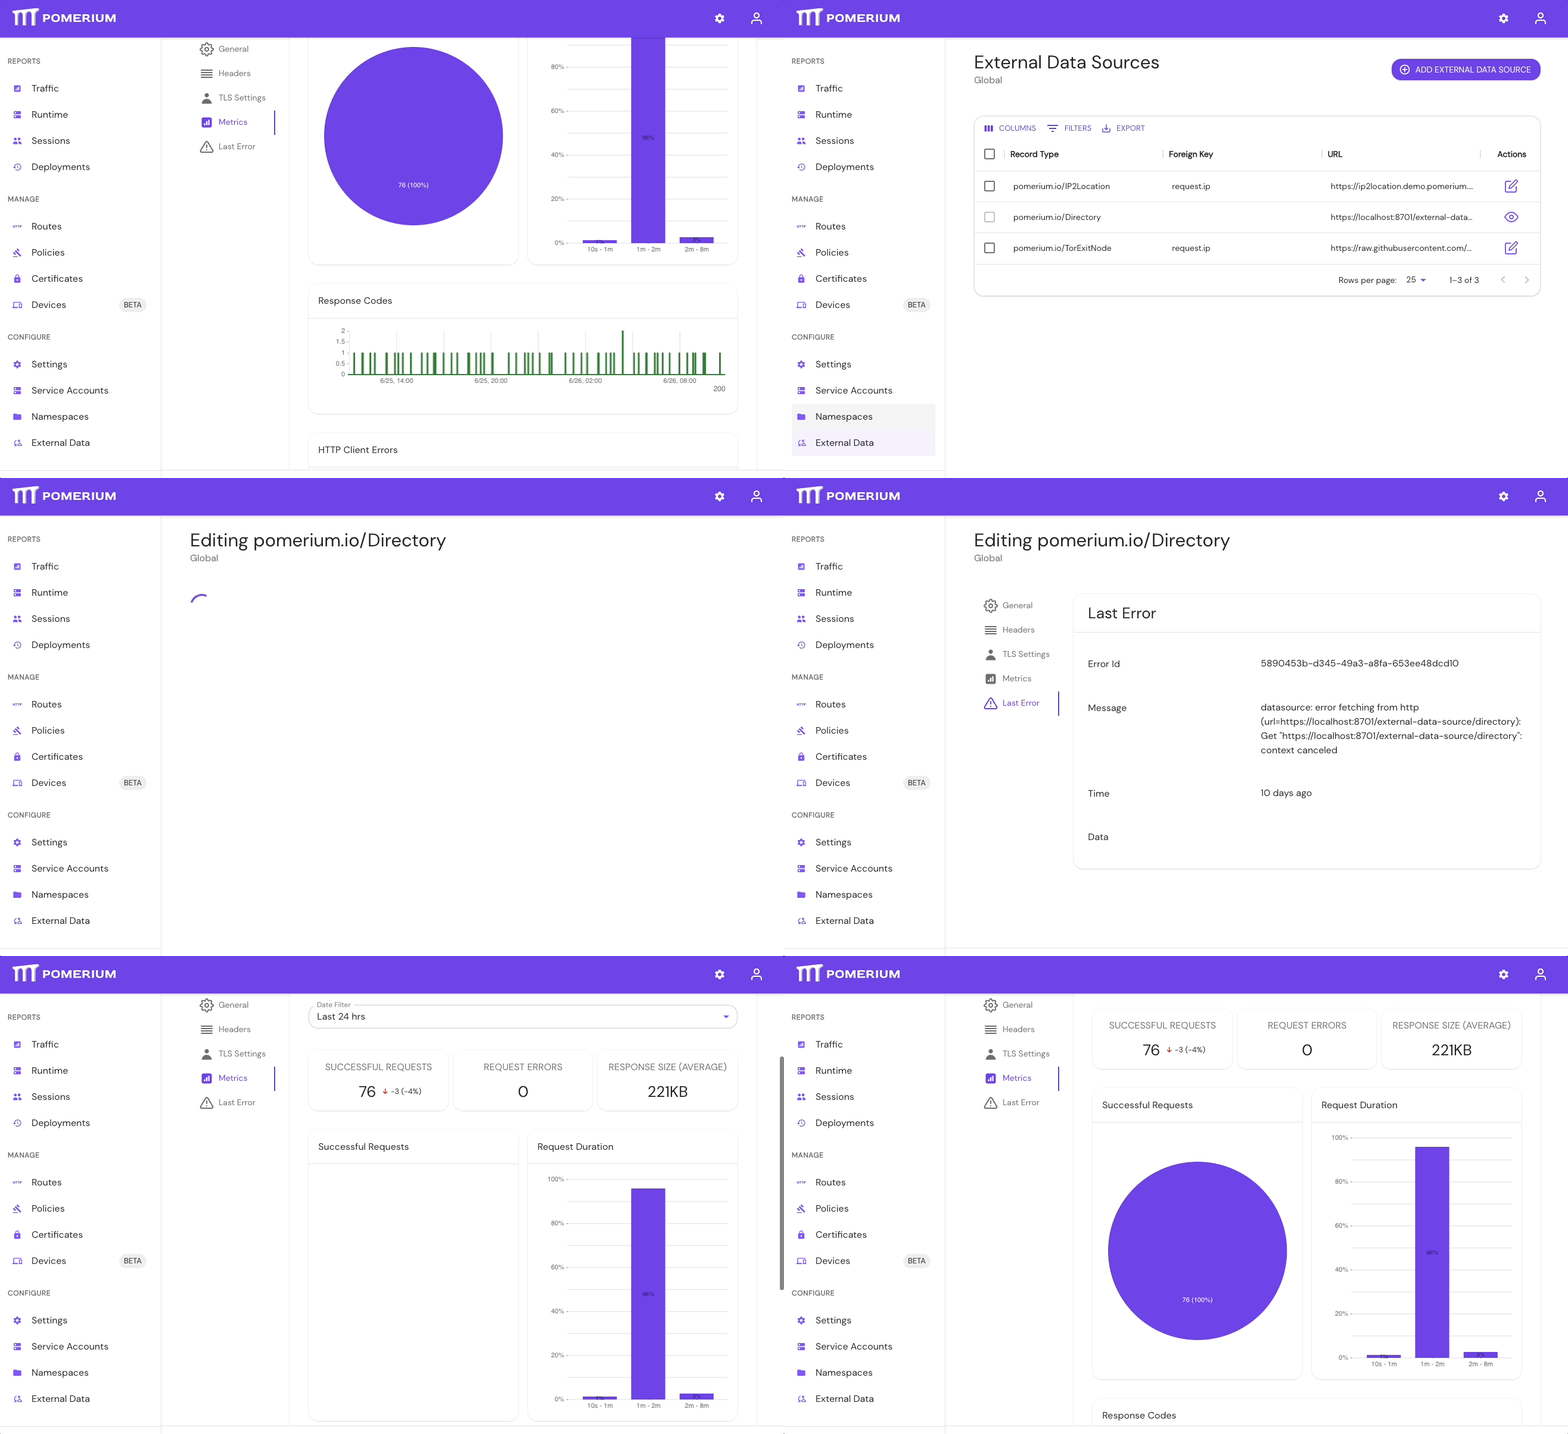
If your directory sync fails, use the External Data > Last Error and Metrics dashboards to determine the source of the failure, and review your Console logs as well. If the failure is due to a timeout, increase the IdP Polling Min/Max Delay settings until the sync completes.
- In the Console, go to External Data > Last Error to check for errors that may have caused the sync to fail. Go to External Data > Metrics to review request durations:

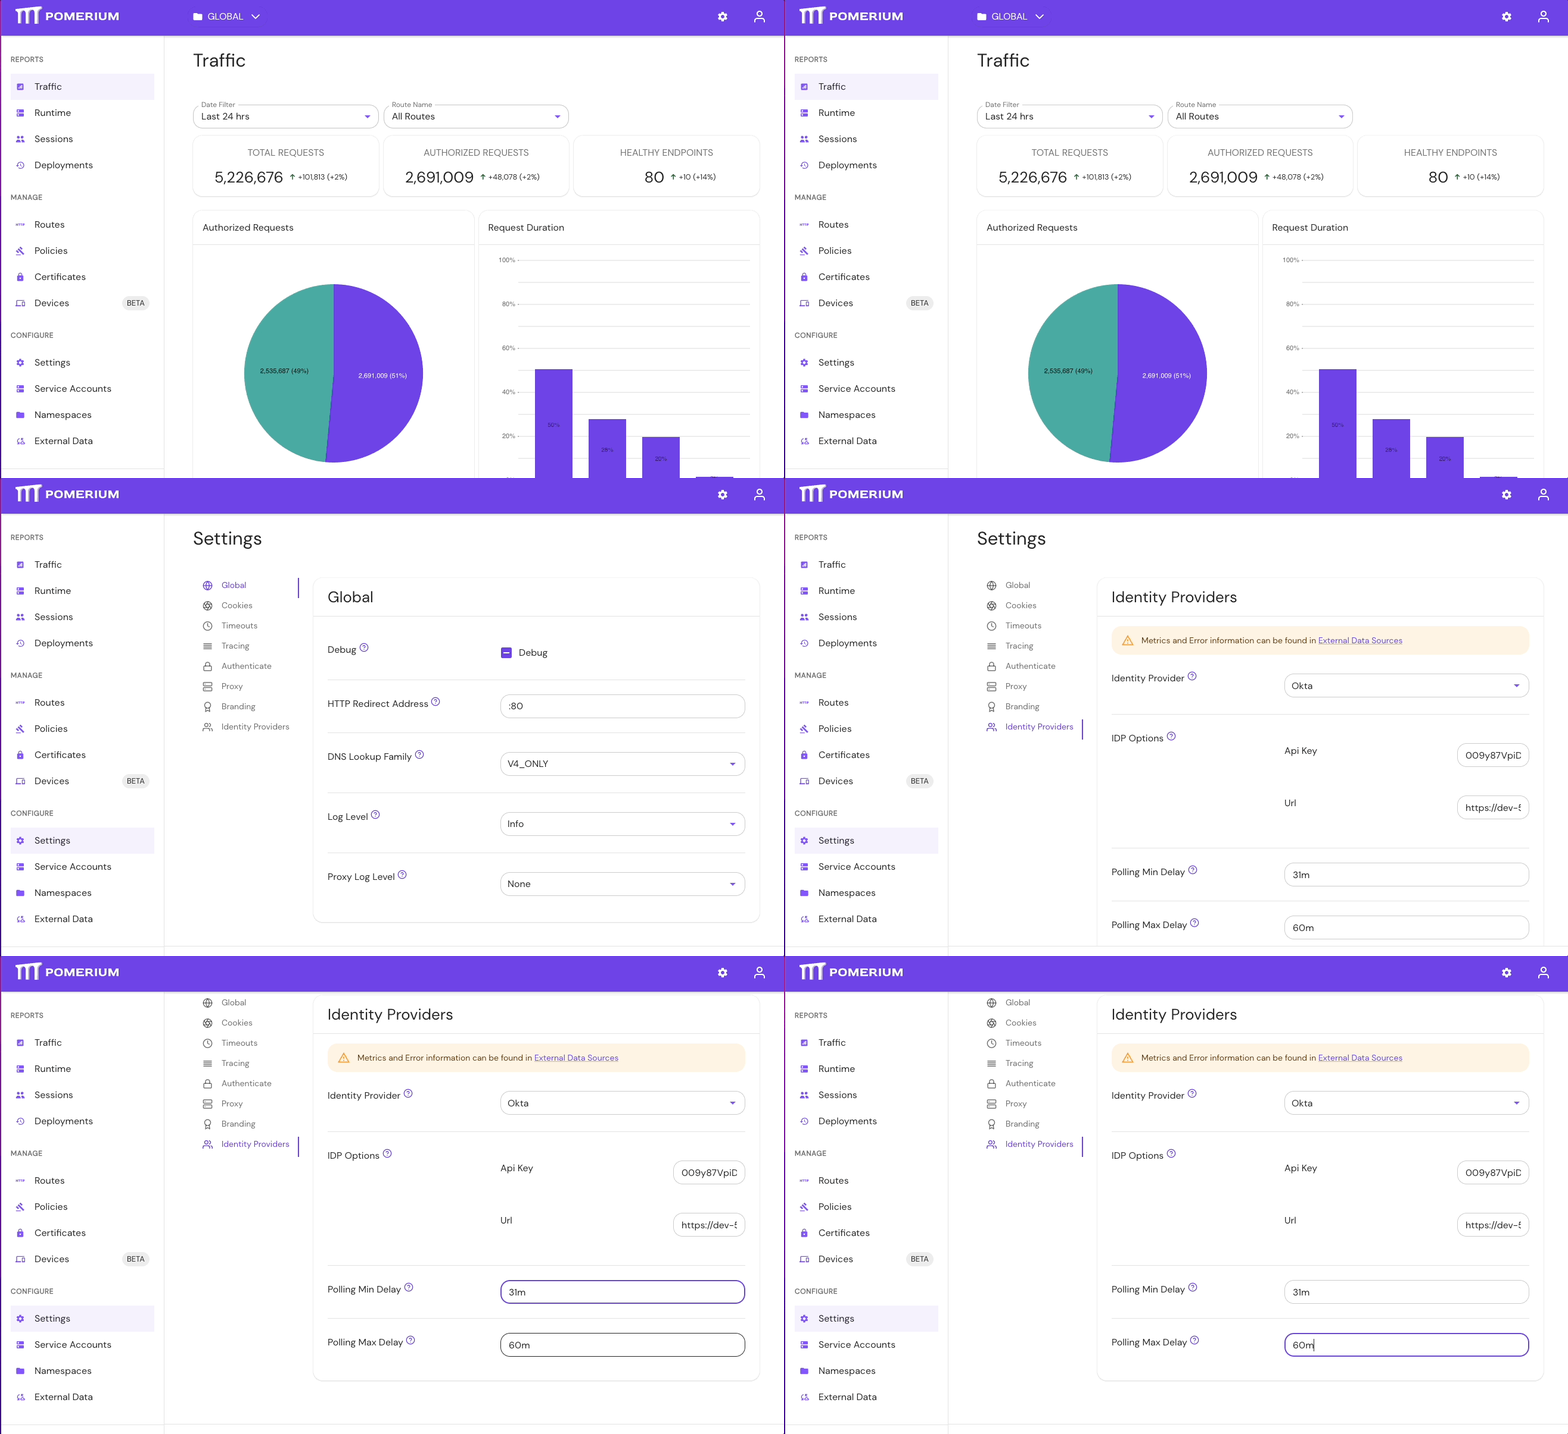
- Select Settings > Identity Providers to see the IdP Polling Min/Max Delay settings. Increase the Polling Min Delay and Polling Max Delay settings before attempting to sync your directory again. Continue to monitor the sync; if it fails due to timeout, increase the durations.

See Identity Provider Polling Min/Max Delay for more information.
Envoy error messages
Because Pomerium relies on Envoy to manage HTTP connections, you will notice Envoy connection errors and messages at some point in your logs as you configure Pomerium.
The Envoy Response Code Details provides an exhaustive list of Envoy-related message details.
We've repurposed a truncated version of the Response Code Details list in the table below for your convenience:
| Name | Description |
|---|---|
| absolute_path_rejected | The request was rejected due to using an absolute path on a route not supporting them. |
| admin_filter_response | The response was generated by the admin filter. |
| cluster_not_found | The request was rejected by the router filter because there was no cluster found for the selected route. |
| downstream_local_disconnect | The client connection was locally closed for the provided reason. |
| downstream_remote_disconnect | The client disconnected unexpectedly. |
| duration_timeout | The max connection duration was exceeded. |
| direct_response | A direct response was generated by the router filter. |
| filter_added_invalid_request_data | A filter added request data at the wrong stage in the filter chain. |
| filter_added_invalid_response_data | A filter added response data at the wrong stage in the filter chain. |
| filter_chain_not_found | The request was rejected due to no matching filter chain. |
| filter_removed_required_request_headers | The request was rejected in the filter manager because a configured filter removed required request headers. |
| filter_removed_required_response_headers | The response was rejected in the filter manager because a configured filter removed required response headers or these values were invalid (e.g. overflown status). |
| internal_redirect | The original stream was replaced with an internal redirect. |
| low_version | The HTTP/1.0 or HTTP/0.9 request was rejected due to HTTP/1.0 support not being configured. |
| maintenance_mode | The request was rejected by the router filter because the cluster was in maintenance mode. |
| max_duration_timeout | The per-stream max duration timeout was exceeded. |
| missing_host_header | The request was rejected due to a missing Host: or :authority field. |
| missing_path_rejected | The request was rejected due to a missing Path or :path header field. |
| no_healthy_upstream | The request was rejected by the router filter because there was no healthy upstream found. |
| overload | The request was rejected due to the Overload Manager reaching configured resource limits. |
| rejecting_because_detection_failed | The request was rejected because the original IP couldn’t be detected. |
| path_normalization_failed | The request was rejected because path normalization was configured on and failed, probably due to an invalid path. |
| request_headers_failed_strict_check | The request was rejected due to x-envoy-* headers failing strict header validation. |
| request_overall_timeout | The per-stream total request timeout was exceeded. |
| request_payload_exceeded_retry_buffer_limit | Envoy is doing streaming proxying but too much data arrived while waiting to attempt a retry. |
| request_payload_too_large | Envoy is doing non-streaming proxying and the request payload exceeded configured limits. |
| response_payload_too_large | Envoy is doing non-streaming proxying and the response payload exceeded configured limits. |
| route_configuration_not_found | The request was rejected because there was no route configuration found. |
| route_not_found | The request was rejected because there was no route found. |
| stream_idle_timeout | The per-stream keepalive timeout was exceeded. |
| upgrade_failed | The request was rejected because it attempted an unsupported upgrade. |
| upstream_max_stream_duration_reached | The request was destroyed because of it exceeded the configured max stream duration. |
| upstream_per_try_timeout | The final upstream try timed out. |
| upstream_reset_after_response_started{details} | The upstream connection was reset after a response was started. This may include further details about the cause of the disconnect. |
| upstream_reset_before_response_started{details} | The upstream connection was reset before a response was started This may include further details about the cause of the disconnect. |
| upstream_response_timeout | The upstream response timed out. |
| via_upstream | The response code was set by the upstream. |
Miscellaneous
Invalid Certificates from Command Line Tools
When using Let's Encrypt certificates, you must use the fullchain.pem file, not cert.pem in order to include intermediate certs. Browsers like Chrome will store intermediate certs for LE but other tools (like curl) don't, which is why your route might look fine in a web browser, but not when curl'd or used for TCP tunneling.
Handle self-signed certificate warning
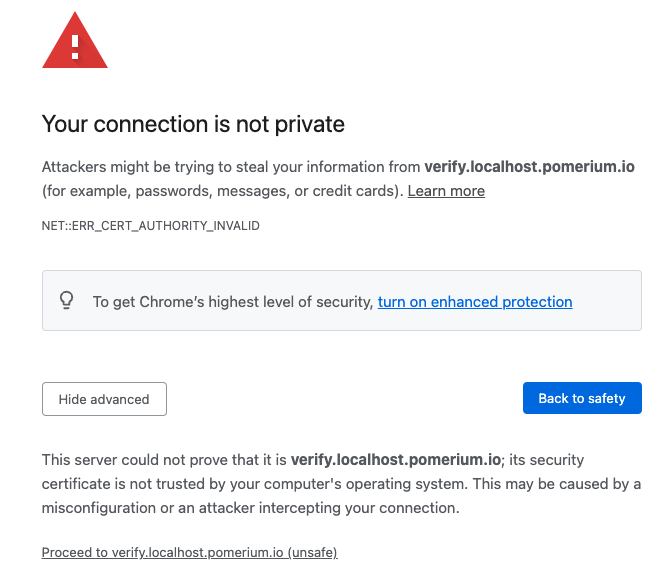
If you're testing Pomerium locally with self-signed certificates, you may encounter the following self-signed certificate warning:

To resolve this error:
- Select Advanced
- Select Proceed to verify.localhost.pomerium.io (unsafe)
If you don't see an Advanced option:
- Click anywhere in the window
- Type
thisisunsafe - Make sure Reload is selected
- Select Enter
Your browser will redirect you to the route defined in your policy.